Factors Contributing to the Incidence of Dark Cutting Beef1

J. A. Scanga, K. E. Belk2, J. D. Tatum, T. Grandin, and G. C. Smith

Department of Animal Sciences, Colorado State University, Fort Collins 80523-1171

J. Anim. Sci. 1998. 76:2040-2047
Received November 3, 1997
Accepted April 20, 1998

1 This project was funded by a grant from the National Cattleman's Beef Association -- Beef Quality Assurance Task Force, Englewood, CO.
2 To whom correspondence should be addressed: Phone: 970/491-5226; Fax: 970/491-0278; E-mail: kbelk@ceres.agsci.colostate.edu


ABSTRACT: The 1995 National Beef Quality Audit reported that dark cutting beef (dark cutters) cost $6.08 per animal harvested in the United States. Feedlot data were obtained over a 3-yr period from nine commercial feedyards (15,439 pens of cattle; 2,672,223 total cattle). Feedyard, gender, implant treatment, days from final implant to harvest, maximum and minimum daily temperatures, and temperature fluctuations from 2 d before harvest to the day of harvest all contributed (P < .05) to the incidence of dark cutters. Heifers yielded a higher (P < .05) percentage of dark cutters per pen and, when reimplanted a second time with an estrogenic implant, produced greater (P <.05) mean percentages of dark cutters per pen than heifers reimplanted with either androgens or combination (androgen and estrogen) growth promotants. Furthermore, heifers produced higher (P < .05) mean percentages of dark cutters per pen than steers during periods of hot (> 35°C) weather 2 to 1 d before harvest. Steers, when treated with a combination (androgen and estrogen) implant when entering the feedyard and as a reimplant, produced higher (P <.05) mean percentages of dark cutters per pen when compared to other moderate growth-promoting implant strategies. When producers opted to implant steers with estrogenic growth promotants, either as the cattle entered the feedlot or as a final reimplant before harvest, the occurrence of dark cutters was reduced from 9.2 per thousand cattle shipped to 2.0 and .5 per thousand cattle shipped, respectively. Producers that reimplanted heifers before harvest with products that were not primarily estrogenic reduced the occurrence of dark cutters from 10.4/1,000 cattle shipped to 5.2/1,000 cattle shipped when androgen-based growth promotants were used and to 3.5/1,000 cattle shipped when combination (androgen and estrogen) implants were administered. In addition to implant selection, those producers that held cattle on feed over 100 d past reimplantation reduced the incidence of dark cutters per pen by an average of 38% among heifers and 69% among steers. By reducing the occurrence of dark cutters, there is an opportunity for beef producers to realize large economic savings.

Key Words: Beef, Quality, Management, Values


Introduction

The 1995 National Beef Quality Audit (NBQA) reported that dark cutting beef carcasses (dark cutters) result in a loss of $6.08 per animal harvested in the United States (Smith et al., 1995). Dark cutters result from preharvest stress, which depletes muscle glycogen stores and thus reduces the glycogen needed to produce the lactic acid that reduces the pH of postmortem muscle. The abnormally high pH (>6.0) increases the light-absorption and water-binding abilities of postmortem muscle and results in an undesirable, dark, firm, and dry cut lean surface (Lister, 1988). Even though this is understood at the clinical level, the stress factors that induce the condition are not as clear. Weather, growth promotants, genetics, disposition, and handling practices before harvest all may play a role in creating the dark cutting condition (Hedrick et al., 1959; Smith et al., 1993; Voisinet et al., 1997).

Grandin (1992) and Smith et al. (1993) reported that the occurrence of dark cutting beef (DCB) is highest during very cold weather combined with precipitation, which increases the rate of body-heat loss and elicits shivering. The incidence of DCB is also high in very warm weather or when large fluctuations in temperature occur over short periods of time.

Hedrick et al. (1959), Grandin (1992), and Shackelford et al. (1994) reported that control of antemortem stress through proper management would be the most effective method to reduce the incidence of DCB.

Hedrick et al. (1959), Grandin (1992), and Smith et al. (1993) identified animal gender, biological type, use of growth promotants, and handling as potential contributors to an increased incidence of DCB. Therefore, the objective of this study was to use a large commercial database to identify and quantify management (biological type, implant type, and implant administration) and environmental factors that affect the incidence of DCB and to develop decision trees for use in the reduction of losses in carcass value as a result of DCB.

Experimental Procedures

Proprietary feedlot data were obtained from nine large commercial feedlots. Included in the database were pen size (number of cattle), on-feed weight, average daily gain, dry matter intake, growth promotant history (type and strategy), time from final implant to harvest (days), number of days on feed, hot carcass weight (HCW), USDA quality and yield grade distribution, and the number of dark cutters that resulted from each pen of fed cattle. Added to the database were climatic factors corresponding to each individual feedyard, such as minimum and maximum ambient air temperatures and precipitation on the day of harvest and at 1, 2, and 3 d before slaughter, that may have affected the incidence of dark cutters before harvest. Growth promotants were classified as androgen (Synovex-H®, Implus-H®, Finalplix-H/S® and Heiferoid®); estrogen (Synovex-S®, Ralgro®, Implus-S®, Compudose®, and Steeroid®); combination (Revalor-H/S®); double androgens (Finaplix® and Synovex-H®); and estrogen/combinations (Synovex-S®/Revalor®). Implantation strategies were determined by production combinations used in the surveyed feedlots and classified according to Beef Customer Satisfaction (BCS) (NLSMB, 1995). Intact heifers within this database were supplemented with melangesterol acetate at .05 mg/heifer/d during feeding with no withdrawal period before harvest.

Data were compiled for the period between June 1, 1993, through July 31, 1996 (n = 15,439 pens of cattle), encompassing 2,672,223 total cattle, which produced 18,106 dark cutters, and equaling $4,024,058.50 in losses ($1.51 per steer, heifer, or spayed heifer harvested in this study) as a result of nonconformance (USDA-AMS, April 14, 1996).

Statistical Analysis

Data were transformed using a square root function to eliminate heterogeneity of subclass variance during analysis. Transformed data were evaluated using the mixed models analysis of variance procedures of SAS (1996). Means and quantitative data are reported in the unit of measure in which data were collected (e.g., percentage of dark cutters per pen). Data were analyzed in a model that included the percentage of dark cutters per pen as the dependent variate, fixed independent effects of feedyard, gender, on-feed implant, reimplantation just before harvest, implantation strategy, and biological type (Brahman, British, Continental, Dairy [includes purebred dairy cattle and Holstein x Angus crossbred] and Mexican) and the random effects of time from final implant to harvest, maximum daily temperature, minimum daily temperature, and daily fluctuation between high and low temperatures (day of and 1, 2, and 3 d before slaughter). Continuous random variables (days from reimplantation to harvest, temperature, and precipitation) were grouped into fixed effect subclasses for analysis using frequency distributions that allowed determination of subclass ranges for each variate that represented natural points of segregation in the normal incidence of dark cutters (i.e., days from last implantation to slaughter and average high and low temperatures). Because of computing resource limitations, it was not possible to evaluate the simple ANOVA model that would have included all aforementioned variables and their interactions. Therefore, all effects were tested as single main effects and then sequentially entered into higher-order interaction models, partitioning single interactions within gender subclasses. Interactions were limited to third-order interactions for mean separation purposes; however, a fourth-order interaction was used to develop schematic management diagrams. Means were separated using pairwise comparisons of means SAS (1996).

Results

Feedyard

Mean percentages of dark cutters per pen differed (P <.05) between individual feedyards. This demonstrated that the incidence of dark cutters was partially due to different management philosophies or to structural attributes of the feedyards and suggests that, under proper management techniques, the incidence of dark cutters could be reduced (Table 1).

Table 1. Least squares means and confidence intervals for percentages of dark cutters per pen by individual feedyard
Feedyard Percentage of dark cutters 95% Confidence interval
A .64w .53-.75
B .20x .17-.22
C .44w .36-.53
D .08yz .06-.10
E .42w .33-.52
F .08y .06-.11
G .05z .04-.06
H .07z .05-.09
I .09y .07-.11
w,x,y,z Means lacking a common superscript letter differ (P <.05).

gender

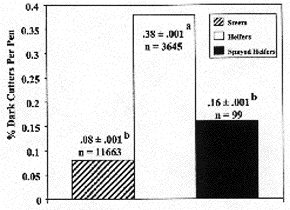
gender, which dictates numerous management practices, also contributed (P < .05) to the incidence of dark cutters (Figure 1). Intact heifers produced higher (P < .05) mean percentages of dark cutters across all pens and feedyards, which indicated a higher susceptibility for heifers to dark cutting than steers and spayed heifers. Owing to confounding of gender with other management decisions, all subsequent analyses were conducted by partitioning fixed and interactive effects within gender.

Figure 1. Least squares means for the incidence of dark cutters within an individual pen for steers, heifers, and spayed heifers. Means lacking common superscript letters differ (P < .05).

Implantation

Implants were classified similarly to those used in the Beef Customer Satisfaction project (NLSMB, 1995). Effects of the initial implantation, as cattle entered the feedyard, or the last, before harvest (reimplantation), on the incidence of dark cutters per pen were evaluated (Table 2).

Table 2. Least squares means ± SEa for the percentage of dark cutters per pen by type of implant administered to steers and heifers as they were placed in the feedyard and underwent reimplantation before harvest.
Item LS Mean ± SE for DCb, % No. of pens Percentage of pens > 6% DCf
On-feed implant
Steers
Combinationc .84y ±.003 201 6.5
Estrogend .09z ±.001 968 .1
Heifers
Androgene .60 ±.003 263 1.9
Combination .65 ±.094 8 0
Estrogen .27 ±.044 28 3.6
Reimplant given just before harvest
Steers
Androgen .09x ±.001 4,455 .7
Combination .20w ±.001 1,772 2.1
Estrogen .03y ±.001 581 0
Heifers
Androgen .52z ±.001 1,177 5.6
Combination .35z ±.029 31 3.2
Estrogen 1.04y ±.005 203 6.9
a Standard error of the least squares means.
b Dark cutters (DC).
c Implants contained androgen and estrogen.
d Implants contained mostly estrogen.
e Implants contained mostly androgens.
f Pens with a greater than 6% incidence of dark cutters were considered epidemics and termed "blowouts."

Within steers, pens of cattle that were treated with implants containing androgens and estrogens (combination implants) as they entered the feedyard resulted in higher (P <.05) mean percentages of dark cutters per pen and a numerically higher proportion of pens that had a 6% or higher incidence of DCB than did steers treated solely with estrogen implants as they entered the feedyard. On-feed implants did not affect (P > .05) the mean percentage of dark cutters per pen within heifers (Table 2); however, heifers given an estrogenic implant as they entered the feedyard were associated with a numerically higher proportion of pens that produced a 6% or higher incidence level of DCB.

Table 3. Least squares means ± SEa for the percentage of dark cutters per pen by implantation strategy for steers and heifers and the proportion of pens above a 6% incidence levelb
Implantation Strategyc No. of pens LS Mean ± SE of % DCd Pens > 6% DC %
Steers
Combinatione/Combinationf 165 .86y ±.003 7.88
Estrogen/Estrogen 553 .08z ±.009 0
Estrogen/Combination 61 .19z ±.008 1.64
Heifers
Double Androgen/Androgen 6 .67yz ±.096 0
Androgen/Double Androgen 11 .26z ±.052 0
Androgen/Androgen 129 .54yz ±.001 3.1
Androgen/Combination 10 .54z ±.084 --
Androgen/Estrogen 46 1.66y ±.033 0
Estrogen/Estrogen 12 .92yz .134 8.33
a Standard error of the least squares means.
b Pens with a greater than 6% incidence of dark cutters were considered epidemics and termed "Blowout" pens.
c See Table 5 for strategy composition.
d Dark cutters (DC).
e Implant given as the cattle came on-feed.
f Implant given as reimplants before harvest (final implant).
y,z Means within gender class lacking common superscript letter differ (P < .05).

Pens of steers that were reimplanted with combination implants (androgens and estrogens) as the final implant before harvest exhibited a higher (P < .05) incidence of dark cutters and a greater numerical proportion of pens with more than a 6% incidence rate of dark cutters than did pens of steers that were administered either androgen or estrogen implants as the final implant before harvest (Table 2). Additionally, steers that were reimplanted with androgen had a higher (P <.05) mean incidence of DCB per pen than steers reimplanted with estrogen. Intact heifers treated with estrogenic implants as the reimplant produced higher (P <.05) mean percentages of dark cutters per pen and a greater proportion of pens with a 6% or higher incidence level of dark cutters than pens of intact heifers that were treated with either androgen or combination (androgen and estrogen) implants as the final implant before harvest (Table 2).

Implantation strategies were constructed using the on-feed implant type and reimplant type, thus developing implantation strategies administered during the time on feed. Mean percentages of dark cutters per pen by implant strategy are reported in Table 3. Steers treated with combination on-feed implants, followed by combination reimplants, showed a higher (P <.05) mean percentage of dark cutters per pen and a higher percentage of pens over a 6% incidence level of DCB than either steers given a estrogen on-feed implant followed by a estrogen reimplant or given an estrogen on-feed implant followed by a combination (androgen and estrogen) reimplant. Implantation strategies using estrogen as the reimplant in heifers had a higher (P <.05) percentage of dark cutters per pen than strategies that used either combination or double androgen reimplantation treatment. Moreover, 8.3% of heifers treated with an estrogen on-feed implant followed by an estrogen reimplant before harvest had over a 6% incidence level of DCB.

As the duration between final implant and harvest increased (>100 d), mean percentages of dark cutters per pen declined (P < .05) across all genders and implant types, except for steers reimplanted with androgens and heifers administered estrogen as a reimplant before harvest (Table 4). Pens of steers implanted with androgens less than 100 d before harvest had lower (P <.05) mean percentages of dark cutters than pens of steers left on feed longer than 100 d from receiving the last implant. Overall, these data indicated that cattle tended to have a lower incidence of DCB per pen when the duration from reimplantation to harvest was longer than 100 d.

Table 4. Least squares means ± SEa for the percentage of dark cutters per pen by the reimplant treatment before harvest and the time between the reimplantation and harvest for steers and heifers
Mean percentage of dark cutters per pen
Last Implant < 100 db > 100 d
Steers
Androgenc .02z ±.021 .19wx ±.02
Combinationd .32w ±..001 .17x ±..001
Estrogene .09y ±.001 .07z ±.001
Heifers
Androgen .58u ±.001 .42v ±.001
Combination 1.74s ±.011 .50uv ±.003
Estrogen .92t ±.002 .78t ±.002
a Standard error of the least squares mean.
b Time (d) from receipt of final implant to harvest.
c Implants contained androgens and were admimstered when cattle were placed in the feedyard.
d Implants contained androgen and estrogen and were administered as cattle were placed in the feedyard.
e Implants contained estrogen and were administered when cattle were placed in the feedyard
s,t,u,v,w,x,y,z Means within and across subclass lacking common superscript letters differ (P < .05).

Environment

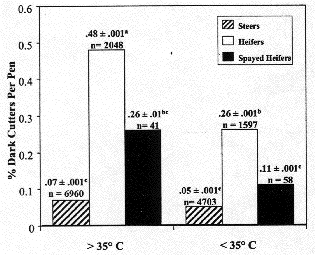
For intact heifers, maximum temperatures from 2 d and 1 d before harvest were averaged, and, during periods when this measurement was above 35°C, they produced higher (P <.05) percentages of dark cutters per pen than when the average maximum temperatures 2 d to 1 d before harvest were below 35°C (Figure 2). Among steers and spayed heifers, average maximum temperatures above 35°C from 2 d to 1 d before harvest increased the percentage of dark cutters per pen as compared with periods when the average maximum temperatures 2 d to 1 d before harvest were below 35°C; but these differences were not (P> .05) significant. When average temperatures were below 0°C 2 d to 1 d before harvest, heifers had a higher (P < .05) incidence of DCB than when temperatures were above 0°C and only when precipitation was greater than 5.0 mm. Average temperatures below 0°C 2 d to 1 d before harvest had no effect (P > .05) on the incidence of dark cutters within steers (Table 5).

Figure 2. Least squares means for the incidence of dark cutters within an individual pen during periods of hot (>35°C), average, and high daily temperatures from 2 to 1 d before harvest for steers, heifers, and spayed heifers. Means lacking common superscript letters differ (P < .05).

Table 5. Least squares means ± SEa for the percentage of dark cutters per pen stratified by average minimum air temperatures and accumulated precipitation 2 to 1 d before harvest
Item Temp.b > 0°C,
Prec.c < 5.0 mm
Temp. > 0°C,
Prec. > 5.0 mm
Temp. < 0°C,
Prec. < 5.0 mm
Temp. < 0°C,
Prec. > 5.0 mm
Steers .07z ±.001 .04z ±.002 .06z ±.001 .08z ±.002
Heifers .39yz ±.001 .21z ±.001 .46y ±.005 .50y ±.001
Spayed Heifers .13z ±.001 .33yz ±.001 .27yz ±.006 .02z ±.068
a Standard error of the least squares means.
b Average minimum daily temperature (above or below 0°C) 2 to 1 d before harvest.
c Total accumulated precipitation (above or below 5.0 mm) 2 to 1 d before harvest.
y,z Means across and within subclasses lacking common superscript letters differ (P < .05).

Temperature fluctuations at 1, 2, and 3 d before harvest are presented in Table 6. Twenty-four hours before harvest, when the absolute difference between the daily high and low temperature was greater than 5.6°C, the incidence of dark cutters within steers was higher (P < .05) than in periods when the absolute difference between the daily high and low temperature was less than 5.6°C. At both 2 and 3 d before harvest, when daily temperature fluctuations were above 5.6°C, heifers showed a higher (P < .05) mean incidence of dark cutters per pen, which indicated that large temperature changes over a short period of time (1 to 3 d) induce stress and increase the incidence of dark cutters.

Table 6. Least squares means ± SEa for the percentage of dark cutters per pen stratified by absolute daily temperature fluctuation at 1, 2, and 3 d before harvest
1 db 2 d 3 d
Steers
< 5.6°Cc .03z ±.001 .03y ±.002 .04z ±.002
> 5.6°C .07y ±.001 .07y ±.001 .07z ±.001
Heifers
< 5.6°Cc .30x ±.004 .12y ±.006 .21y ±.005
> 5.6°C .39x ±.001 .40x ±.001 .40x ±.001
a Standard error of the least squares means.
b Time (days) before harvest fluctuations were measured.
c Absolute temperature difference between daily high and low temperatures.
x,y,z Means within time period lacking common superscript letters differ (P <.05).

Discussion

Owing to the significant effect of feedyard on the incidence of dark cutters per pen, it became apparent that DCB was affected by differing management philosophies, facility construction, and cattle-handling procedures. These findings were consistent with those of Hedrick et al. (1959), Grandin (1992), and Smith et al. (1993), who identified management practices that are unique to feedyards, such as handling and working facilities, as factors that are potentially stressful to cattle. Therefore, improved facilities, handling practices, and cattle management can reduce the occurrence of dark cutters in commercial feedlots.

Factors in this study that had the greatest influence on the incidence of dark cutters seemed to be gender and the aggressive use of growth promotants. It was clear that heifers present a higher inherent risk of becoming dark cutters than do steers or spayed heifers. Studies by Fleming and Luebke (1981), Voisinet et al. (1997a), and Voisinet et al. (1997b) all found that females had a more excitable temperament and that fearfiilness was greatest in nulliparous females. Additionally, Voisinet et al. (1997) found that heifers had a higher (P < .05) incidence of 'borderline" dark cutters. This could explain why females, especially those given exogenous estrogen, in the present study seemed to be much more susceptible to dark cutting epidemics (pens > 6% DCB). Flemming and Luebke (1981) associated this behavior with the fact that estrogen secretion in parous females is lower than estrogen secretion in nulliparous females, which were found to be more excitable.

Implants have been under suspicion for promoting carcass quality defects since their introduction (Grandin, 1992). Because implants modify growth curves, rates of gain, and nutrient requirements of beef cattle through hormonal changes, adding other sources of stress to hormonal shifts ultimately could increase the risk of dark cutters. Administering combination (androgen and estrogen) implants to steers and estrogen implants to heifers, especially as reimplants before harvest, seemed to inflate the manifestation of stress and ultimately lead to an increase in the incidence of dark cutters.

Environmental factors also played a role in the occurrence of dark cutters. These results paralleled reports by Smith et al. (1993) and Grandin (1992), who reported higher incidences of dark cutters during periods of adverse weather conditions. Management decisions should include environmental factors that could be encountered at the time of harvest, such as extremely hot or cold weather or large temperature fluctuations, and cattle should be managed accordingly to reduce the risk of incurring DCB.

The factors evaluated in this study all additively increased the risk of incurring dark cutters and must be comanaged to optimize these findings. Taking into account all of the factors found to influence the occurrence of dark cutters, decision trees were developed for steers and heifers that present the risk of incurring dark cutters out of 1,000 cattle given specific production factors (Figures 3 and 4). These flow diagrams provide a quick reference for quantifying the risks associated with gender and implantation decisions and the impact that hot (>35°C) weather has on the occurrence of dark cutters. For instance, high risk takers that feed steers would utilize a combination onfeed implant followed with a combination reimplant before harvest. In addition to aggressive use of growth promotants, the time period from reimplant to harvest would be less than 100 d. This management scheme would increase the risk of incurring dark cutters from .8 per 1,000 steers shipped to 13 per 1,000 steers shipped. Furthermore, this could be compounded if the average maximum temperature 2 d to 1 d before harvest is above 35°C; the risk is again increased by 3 per 1,000 steers shipped, totaling a risk of incurring dark cutters of 16 per 1,000 steers shipped (a 20-fold increase in risk). Even though it is an apparently low-percentage risk (1.6%), real economic losses will continue to mount, potentially 20-fold greater than if the incidence of DCB is minimized.
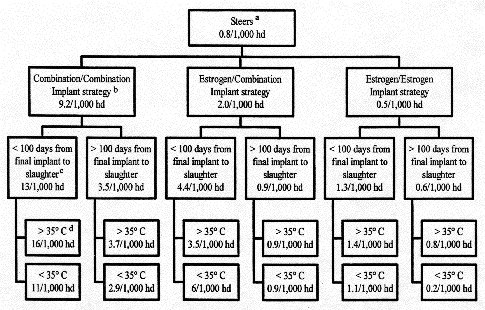
Figure 3. Management guidelines that indicate the risk of incurring dark cutters per 1,000 steers shipped under individual management schemes. The hierarchy utilized agender, bimplant strategy, cdays from final implant to harvest, and daverage maximum daily temperature 2 to 1 d before harvest.

Figure 4. Management guidelines that indicate the risk of incurring dark cutters per 1,000 heifers shipped under individual management schemes. The hierarchy utilized agender, bfinal implant, cdays from final implant to harvest, and daverage maximum daily temperature 2 to 1 d before harvest.

Implications

These data suggest that the use of estrogenic reimplants before harvest in heifers and combination (androgen and estrogen) implants used singly in steers, either as they enter the feedlot or as reimplants before harvest, or the use of combination onfeed, combination reimplantation strategies increases the risk of incurring dark cutting beef (DCB). Additionally, the time from reimplantation to harvest should extend past 100 d to minimize carcass nonconformance that results from DCB. Feedlot management practices should also incorporate seasonal climatic trends (hot weather and large temperature changes) at the time of harvest when determining implant administration. In addition, the use of good handling practices, well-designed handling facilities, and proper shipping practices must also be used. By optimally combining these factors, producers can continue to optimize growth performance with the use of moderate growth-promoting implants but at the same time reduce economic losses and carcass nonconformance that are due to DCB.

Literature Cited

Fleming, A., and C. Luebke. 1981. Timidity prevents the virgin female rat from being a good mother: Emotionality differences between nulliparous and parturient females. Physiol. Behav. 27:863-868.

Grandin, T. 1992. Problems with bruises and dark cutters in harvest steers/heifers. In: Improving the Consistency and Competitiveness of Beef -- A Blueprint for Total Quality Management in the Fed-Beef Industry -- The Final Report of the National Beef Quality Audit -- 1991. Colorado State University, Fort Collins; Texas A&M University, College Station.

Hedrick, H. B., J. B. Boillot, D. E. Brady, and H. D. Naumann. 1959. Etiology of dark-cutting beef. Research Bulletin 717. University MO, Agric. Exp. Stn., Columbia.

Lister, D. 1988. Muscle metabolism and animal physiology in the dark cutting condition. In: Dark-cutting in cattle and sheep -- Proceedings of an Australian workshop. Australian Meat & live-stock Research and Development Corporation, Sydney South, NSW, Australia.

NLSMB. 1995. Beef Customer Satisfaction: A comprehensive in-home product test among frequent beef consumers. National Live Stock and Meat Board, Chicago, IL.

SAS. 1996. SAS® System for Mixed Models. SAS Inst. Inc., Cary, NC.

Shackelford, S. D., M. Koohmaraie, T. L. Wheeler, L. V. Cundiff, and M. E. Dikeman. 1994. Effect of biological type of cattle on the incidence of the dark, firm, and dry condition in the longissimus muscle. J. Anim. Sci. 72:337-343.

Smith G. C., J. W. Savell, H. G. Dolezal, T. G. Field, D. G. Gill, D. B. Griffin, D. S. Hale, J. B. Morgan, S. L. Northcutt, J. D. Tatum, R. Ames, S. Boleman, S. Boleman, B. Gardner, W. Morgan, and M. Smith. 1995. The National Beef Quality Audit. Colorado State University, Fort Collins; Oklahoma State University, Stillwater; Texas A&M University, College Station.

Smith, G. C., J. D. Tatum, and J. B. Morgan. 1993. Dark cutting beef: physiology, biochemistry and occurrence. Colorado State University, Fort Collins.

USDA-AMS-LSD. 1996. United States standards for grades of beef carcasses. Washington, DC.

Voisinet, B. D., T. Grandin, S. F. O'Connor, J. D. Tatum, and M. J. Deesing. 1997a. Bos indicus-cross feedlot cattle with excitable temperaments have tougher meat and a higher incidence of borderline dark cutters. Meat Sci. 46:367-377.

Voisinet, B. D., T. Grandin, J. D. Tatum, S. F. O'Connor, and J. J. Struthers. 1997b. Feedlot cattle with calm temperaments have higher average daily gains than cattle with excitable temperaments. J. Anim. Sci. 75:892-896.


Click here to return to the Homepage for more information on animal behavior, welfare, and care.